Example: Plot HMI
Jupyter Notebook
1 | from __future__ import division, print_function |
Read data
1 | fnames = ('data/hmi.B_720s.20150827_052400_TAI.field.fits', |
1 | from usr_sunpy import read_sdo |
hmi.B_720s.20150827_052400_TAI.field.fits   [4096, 4096]
hmi.B_720s.20150827_052400_TAI.inclination.fits [4096, 4096]
hmi.B_720s.20150827_052400_TAI.azimuth.fits [4096, 4096]
hmi.B_720s.20150827_052400_TAI.disambig.fits [4096, 4096]- Disambiguate:
1 | mapa.data[mapd.data > 3] += 180. |
- Transform to vector components:
1 | mapbx = deepcopy(mapb) |
1 | # Suppress metadata warnings |
1 | mapbz |
SunPy Map
---------
Observatory:         SDO
Instrument:      HMI SIDE1
Detector:        HMI
Measurement:         hmi
Wavelength:      6173.0
Observation Date:    2015-08-27 05:22:21
Exposure Time:       0.000000 s
Dimension:       [4096. 4096.] pix
Coordinate System:   helioprojective
Scale:           [0.504376 0.504376] arcsec / pix
Reference Pixel:     [2033.825928 2053.603271] pix
Reference Coord:     [0. 0.] arcsec
array([[nan, nan, nan, ..., nan, nan, nan],
       [nan, nan, nan, ..., nan, nan, nan],
       [nan, nan, nan, ..., nan, nan, nan],
       ...,
       [nan, nan, nan, ..., nan, nan, nan],
       [nan, nan, nan, ..., nan, nan, nan],
[nan, nan, nan, ..., nan, nan, nan]])- Use
sunpy.instr.aia.aiaprep()Processes a level 1 AIAMap into a level 1.5 AIAMap.
https://docs.sunpy.org/en/stable/api/sunpy.instr.aia.aiaprep.html
From sunpy 0.9.3,
sunpy.instr.aia.aiaprep()supports bothAIAMap&HMIMapobjects.
Note: Improve aiaprep in
<python_path>/site-packages/sunpy/instr/aia.py:
at line: tempmap = aiamap.rotate(...)
add
order=3 (recommend, this will keep NaNs) and set
missing=np.nan in rotate()
There is a modified function aiaprep_usr() in
usr_sunpy
1 | # After `aiaprep`: |
level 1 -> level 1.5 ...
level    = 1.5
rsun_obs = 949.495178 arcsec
r_sun = 1582.4919633333334 pix- Or, use
rotate()manually:
1 | # DO NOT execute this cell if `sunpy.instr.aia.aiaprep()` has been called. |
Level 1.5:
1 | mapbz |
SunPy Map
---------
Observatory:         SDO
Instrument:      HMI SIDE1
Detector:        HMI
Measurement:         hmi
Wavelength:      6173.0
Observation Date:    2015-08-27 05:22:21
Exposure Time:       0.000000 s
Dimension:       [4096. 4096.] pix
Coordinate System:   helioprojective
Scale:           [0.6 0.6] arcsec / pix
Reference Pixel:     [2048.5 2048.5] pix
Reference Coord:     [0. 0.] arcsec
array([[nan, nan, nan, ..., nan, nan, nan],
       [nan, nan, nan, ..., nan, nan, nan],
       [nan, nan, nan, ..., nan, nan, nan],
       ...,
       [nan, nan, nan, ..., nan, nan, nan],
       [nan, nan, nan, ..., nan, nan, nan],
       [nan, nan, nan, ..., nan, nan, nan]])
Check the disk center ('crpix1', 'crpix2'):
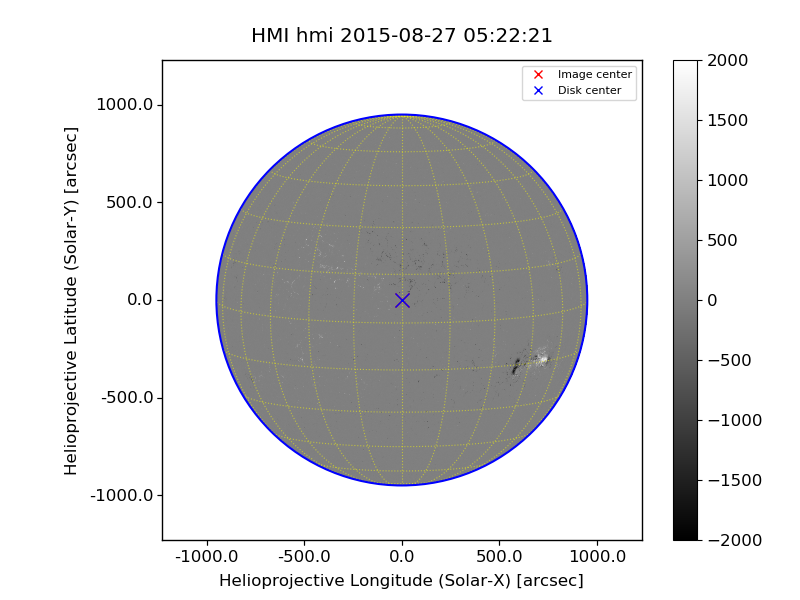
1 | # pixel number start from 1 |
[Image_center] (2047.500, 2047.500) pixel = ( 0.3000,  0.3000) arcsec  (lon, lat) = ( 0.01816,  7.10702) deg
[ Disk_center] (2047.500, 2047.500) pixel = ( 0.0000,  0.0000) arcsec  (lon, lat) = ( 0.00000,  7.08900) deg
[ Observation] (lon, lat, radius) = (0 deg, 7.089 deg, 1.51197e+11 m)
A quick look:
1 | mapbz.peek() |
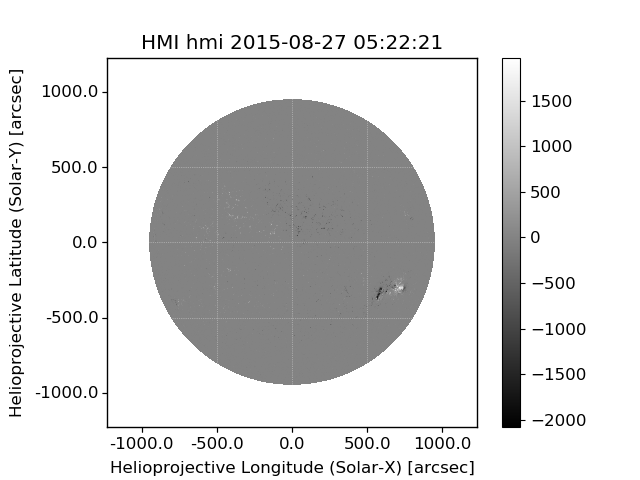
Plot
https://docs.sunpy.org/en/stable/guide/plotting.html?highlight=peek#plotting-maps-with-wcsaxes
User function plot_map() will invoke plot()
of sunpy.
1 | from usr_sunpy import plot_map |
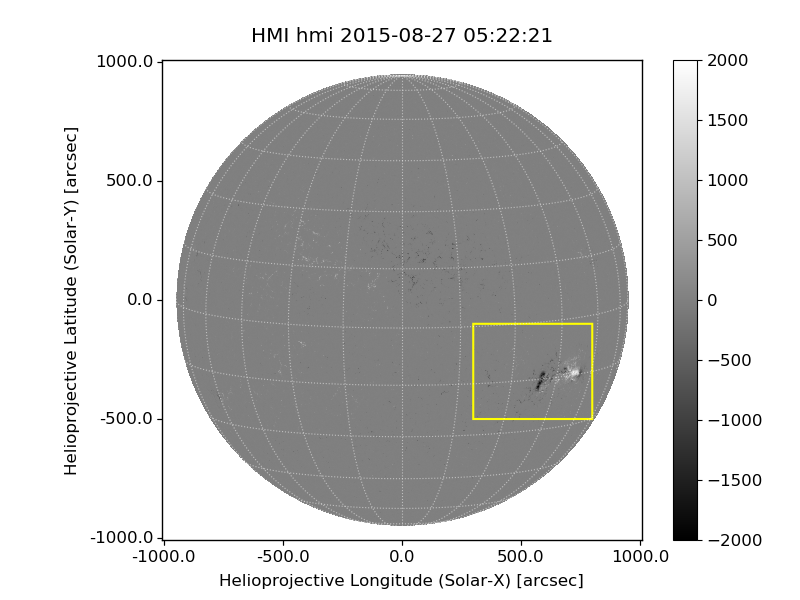
Submap
http://docs.sunpy.org/en/v0.9.3/code_ref/map.html?highlight=peek#sunpy.map.mapbase.GenericMap.submap
http://docs.astropy.org/en/stable/api/astropy.coordinates.SkyCoord.html
submap(bottom_left, top_right=None)
* bottom_left (astropy.units.Quantity or SkyCoord) –
The bottom_left coordinate of the rectangle.
If a SkyCoord it can
have shape (2,) and also define top_right.
If specifying pixel
coordinates it must be given as an Quantity object with units of pixel.
* top_right (astropy.units.Quantity or SkyCoord) – The
top_right coordinate of the rectangle.
Can only be omitted if
bottom_left has shape (2,).
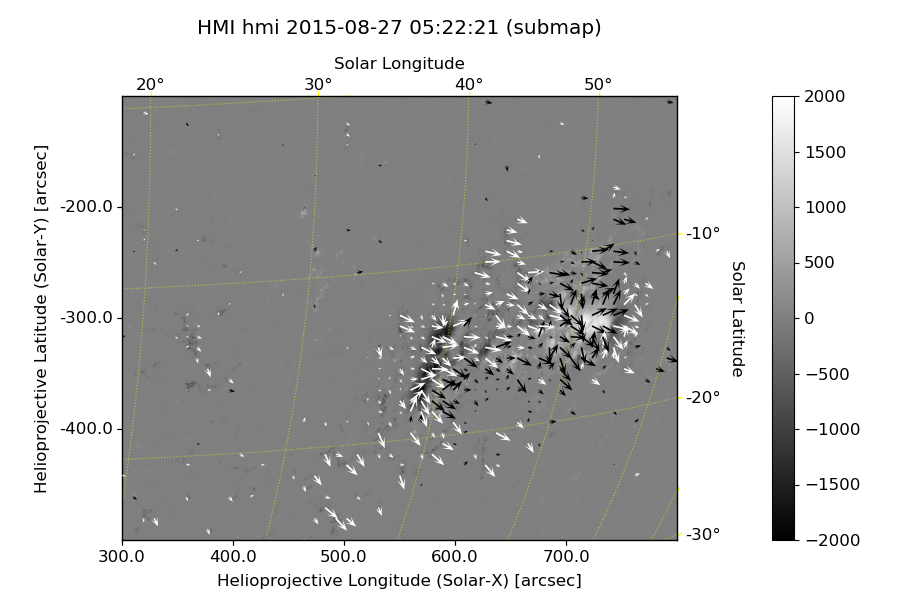
1 | xrange = (300., 800.) * u.arcsec |
Submap: ([300. 800.], [-500. -100.]) arcsec (833 x 666)draw_rectangle(bottom_left, width, height, axes=None, **kwargs)
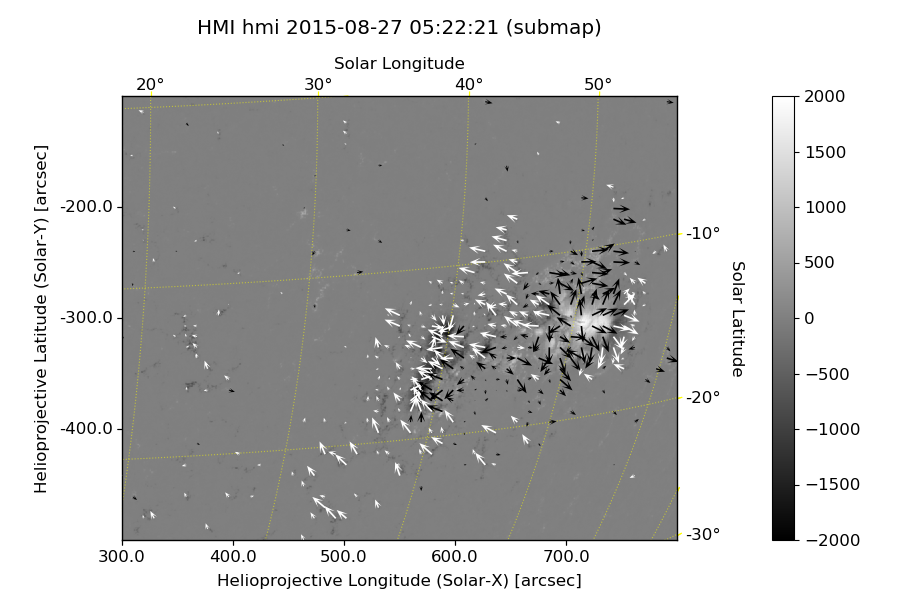
1 | from usr_sunpy import plot_map |
1 | from usr_sunpy import plot_map, plot_vmap |
Without disambiguation:
1 | from usr_sunpy import plot_map, plot_vmap |