(source
/ doc )
1
2
3
4
5
6
7
8
9
10
11
12
13
14
15
16
17
18
19
20
21
22
from __future__ import division, print_function%matplotlib notebook from astropy.coordinates import SkyCoordimport astropy.units as uimport matplotlib.pyplot as pltimport numpy as npimport sunpy.map from copy import deepcopyimport syssys.path.append('../modules' )
Read
data
1
2
3
4
fnames = ('data/hmi.B_720s.20150827_052400_TAI.field.fits' , 'data/hmi.B_720s.20150827_052400_TAI.inclination.fits' , 'data/hmi.B_720s.20150827_052400_TAI.azimuth.fits' , 'data/hmi.B_720s.20150827_052400_TAI.disambig.fits' )
1
2
from usr_sunpy import read_sdomapb, mapi, mapa, mapd = list (map (read_sdo, fnames))
hmi.B_720s.20150827_052400_TAI.field.fits   [4096, 4096]
hmi.B_720s.20150827_052400_TAI.inclination.fits [4096, 4096]
hmi.B_720s.20150827_052400_TAI.azimuth.fits [4096, 4096]
hmi.B_720s.20150827_052400_TAI.disambig.fits    [4096, 4096]
1 2 3 4 5 6 7 8 9 10 11 12 13 14 15 16 17 18 19 20 21 22 23 24 25 mapa.data[mapd.data > 3 ] += 180. mapbx = deepcopy(mapb) mapby = deepcopy(mapb) mapbz = deepcopy(mapb) mapbx.data[:] = mapb.data * np.sin(np.deg2rad(mapi.data)) * np.cos(np.deg2rad(mapa.data + 270. )) mapby.data[:] = mapb.data * np.sin(np.deg2rad(mapi.data)) * np.sin(np.deg2rad(mapa.data + 270. )) mapbz.data[:] = mapb.data * np.cos(np.deg2rad(mapi.data)) for i in {mapbx, mapby, mapbz}: i.meta['hgln_obs' ] = 0. from usr_sunpy import aiaprep_usr as aiaprepimport warningsprint ('level 1 -> level 1.5 ...' )with warnings.catch_warnings(): warnings.simplefilter("ignore" ) mapbx = aiaprep(mapbx) mapby = aiaprep(mapby) mapbz = aiaprep(mapbz) print ('level =' , mapbz.meta['lvl_num' ])print ('rsun_obs =' , mapbz.meta['rsun_obs' ] * u.arcsec)print ('r_sun =' , mapbz.meta['r_sun' ] * u.pix)
level 1 -> level 1.5 ...
level = 1.5
rsun_obs = 949.495178 arcsec
r_sun = 1582.4919633333334 pixSubmap
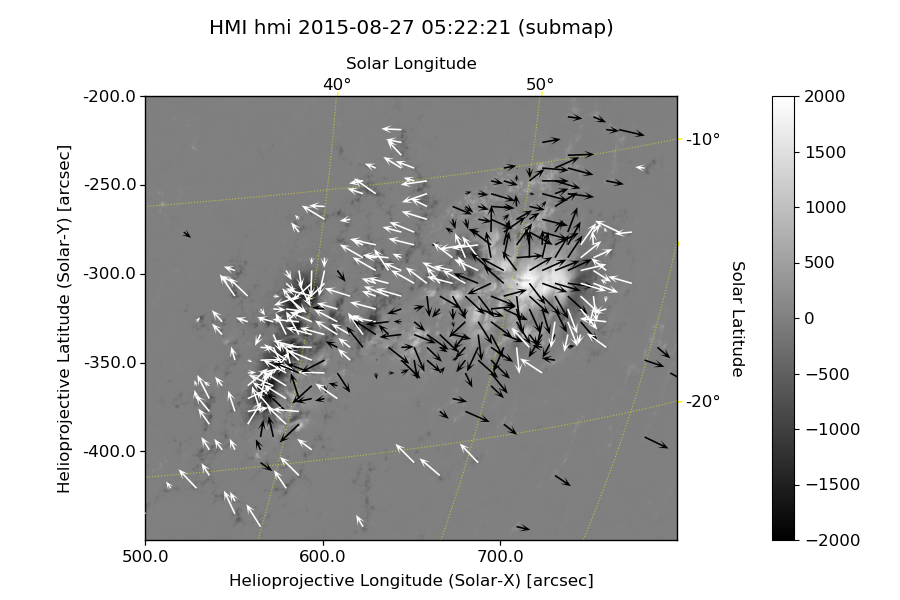
1 2 3 4 5 6 7 8 9 10 11 12 13 14 15 16 17 18 19 20 21 22 23 24 25 26 xrange = (500. ,800. ) * u.arcsec yrange = (-450. ,-200. ) * u.arcsec subcoord = SkyCoord(xrange, yrange, frame=mapbz.coordinate_frame) smapbx = mapbx.submap(subcoord) smapby = mapby.submap(subcoord) smapbz = mapbz.submap(subcoord) print ('Submap: (%s, %s) arcsec (%d x %d)' % (xrange.value, yrange.value, *smapbz.data.shape[::-1 ])) from usr_sunpy import plot_mapfig1 = plt.figure(figsize=(8 , 6 ), dpi=100 ) ax1 = fig1.add_subplot(111 , projection=mapbz) plot_map(mapbz, ax=ax1, vmin=-2000. , vmax=2000. , grid_color='w' ) mapbz.draw_rectangle(subcoord[0 ], xrange[1 ]-xrange[0 ], yrange[1 ]-yrange[0 ], axes=ax1, color='yellow' , linewidth=1.5 ) valid_index = np.where(np.isfinite(mapbz.data)) ax1.set_xlim((valid_index[0 ].min ()-100 , valid_index[0 ].max ()+100 )) ax1.set_ylim((valid_index[1 ].min ()-100 , valid_index[1 ].max ()+100 ));
Submap: ([500. 800.], [-450. -200.]) arcsec (500 x 417)
1
2
3
4
5
6
7
8
9
from usr_sunpy import plot_map, plot_vmapiskip, jskip = (12 , 12 ) fig2 = plt.figure(figsize=(9 , 6 ), dpi=100 ) ax2 = fig2.add_subplot(111 , projection=smapbz) im2 = plot_map(smapbz, ax=ax2, vmin=-2000. , vmax=2000. , grid=10 *u.deg, title=mapbz.latex_name+' (submap)' ) plot_vmap(smapbx, smapby, smapbz, ax2, iskip=iskip, jskip=jskip, cmin=50. , vmax=500. , cmap='binary' , scale_units='xy' , scale=1 /0.05 , minlength=0.02 );
Projection
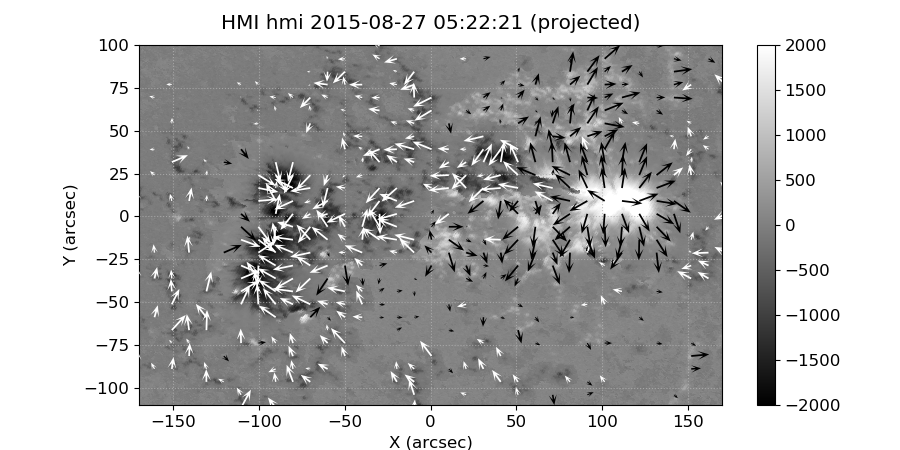
1
2
3
4
5
6
7
from usr_sunpy import image_to_heliohx, hy = image_to_helio(smapbz) smapbx_h, smapby_h, smapbz_h = image_to_helio(smapbx, smapby, smapbz) print ('(xmin, xmax) = (%9.3f, %9.3f) arcsec\n(ymin, ymax) = (%9.3f, %9.3f) arcsec' % (hx.min (), hx.max (), hy.min (), hy.min ()))
(xmin, xmax) = ( -251.988,   251.988) arcsec
(ymin, ymax) = ( -156.811,  -156.811) arcsec
1 2 3 4 5 6 7 8 9 10 11 12 13 14 iskip, jskip = (10 , 10 ) fig3 = plt.figure(figsize=(9 , 4.5 ), dpi=100 ) ax3 = fig3.add_subplot(111 ) im3 = plot_map(smapbz_h, ax=ax3, coords=(hx, hy), cmap='gray' , vmin=-2000. , vmax=2000. , title=mapbz.latex_name+' (projected)' ) plot_vmap(smapbx_h, smapby_h, smapbz_h, ax3, coords=(hx, hy), iskip=iskip, jskip=jskip, cmin=100. , vmax=300. , cmap='binary' , scale_units='xy' , scale=1 /0.04 , minlength=0.02 ); ax3.grid(True , ls=':' , alpha=0.8 ) ax3.set_xlim((-170 ,170 )) ax3.set_ylim((-110 ,100 ));